In the next post - Part 3 - I will demonstrate how to create portfolio level dashboards with the help of EPM Pulse.
So Let's not wait any longer and let's get stared.
Assumptions
- Workflow was created as described in Part 1
- All the elements were created as described in Part 1
- EPM Pulse for Project Server 2010 installed (Watch video : http://www.youtube.com/watch?v=IFpyzPiNUGM )
EPM Pulse overview
FluentPro EPM Pulse is a data visualization platform for Microsoft Project Server 2010 with a focus on self-service. That means that companies can give rights to regular project managers to create their own dashboards for that their projects so project managers can not only "feed" system with the data but also retrieve it and visualize in very easy way using visual tools.
There are 2 main features of EPM Pulse - they are pre-built "Widgets" and Visual Dashboard Designer. Designer allows to add pre-built charts (we call them "Widgets") to the dashboard and re-position / resize them the way user wants. We have built over 150 widgets for both portfolio and project level dashboards and it should cover 99% of all organization needs. Using widgets provides the ability to build dashboards without any development. Add Widgets. Re-position. Re-size. Save. It all takes just couple minutes per dashboard and seconds to make changes if required.
Building dashboards for different stages
As described in Part 1, we have multiple stages in our workflow and ideally we need to have one dashboard per stage but in fact, we can limit them this number to 4 dashboards since on Project Initiation and Project Selection stage, project is very likely is in the same "state":
- Project Initiation / Project Selection Stage
- Project Planning stage
- Project Execution stage
- Project Closing stage / Project Closed stage
Let's start building them.
Project Initiation / Project Selection
On this stage, companies have only high level information about the project and a limited amount of information. Project schedule might exist but might contain only several tasks or proposed key milestones.
There is usually some indication of the requested budget. Project is resourced with resource plan.
We can build dashboard that will show:
- Values of several custom fields (Request Budget, Duration)
- List of Milestones
- Capacity /Planned work / Availability of the team from resource plan
- Planned Work distribution from resource plan
- Planned work by resource department
To create dashboard, click on a Link to EPM Pulse, Select project table and click on "Create New"
This will bring the new dashboard window.
1. Click on Add Widget and select: Project Field Widget from Other tab, Planned Work By Project Department (Resource Plan) from Project Progress tab, Project Milestones and Planned Work Distribution ( Resource Plan) from the Project Summary tab and Project Team Availability (Resource Plan) from Resource Tab and click on Apply button
2. Click on Add Widget and add one more Project Field Widget from Other tab; Click Apply button.
3. Select a project that is on stage Project Initiation or Project Selection using the "Project Filter" button
4. Click on Save and enter the name "Project Initiation Dashboard"
5. Click on Edit
6. Distribute / resize widgets and configure to display. For example, our dashboard can look as following:

For most of the widgets there are 2 dialogs for configuration of the widget setting and look and feel:

7. Click on Properties button, go to Options and select Public as Visibility
8. Save dashboard
Now, we have dashboard created and it should display information from the project. Several recommendations for data in "requests":
- Try to provide as much as possible information
- Create at least one task and set duration so project will have a duration
- Try to match dates in resource plan with project start / finish dates
- Try to define one or several key milestones
On this stage, companies have only high level information about the project and a limited amount of information. Project schedule might exist but might contain only several tasks or proposed key milestones.
There is usually some indication of the requested budget. Project is resourced with resource plan.
We can build dashboard that will show:
- Values of several custom fields (Request Budget, Duration)
- List of Milestones
- Capacity /Planned work / Availability of the team from resource plan
- Planned Work distribution from resource plan
- Planned work by resource department
To create dashboard, click on a Link to EPM Pulse, Select project table and click on "Create New"
This will bring the new dashboard window.
1. Click on Add Widget and select: Project Field Widget from Other tab, Planned Work By Project Department (Resource Plan) from Project Progress tab, Project Milestones and Planned Work Distribution ( Resource Plan) from the Project Summary tab and Project Team Availability (Resource Plan) from Resource Tab and click on Apply button
2. Click on Add Widget and add one more Project Field Widget from Other tab; Click Apply button.
3. Select a project that is on stage Project Initiation or Project Selection using the "Project Filter" button
4. Click on Save and enter the name "Project Initiation Dashboard"
5. Click on Edit
6. Distribute / resize widgets and configure to display. For example, our dashboard can look as following:

For most of the widgets there are 2 dialogs for configuration of the widget setting and look and feel:
7. Click on Properties button, go to Options and select Public as Visibility
8. Save dashboard
Now, we have dashboard created and it should display information from the project. Several recommendations for data in "requests":
- Try to provide as much as possible information
- Create at least one task and set duration so project will have a duration
- Try to match dates in resource plan with project start / finish dates
- Try to define one or several key milestones
Project Planning Stage
On the next stage, Project Planning Stage, we should be focused on the project schedule / milestones, work / cost distribution and resource availability. We will use the same approach for creating dashboard but will use slightly different set of the widgets.Please add following widgets (just as a sample set):
- Project Financial Summary (Baseline), Cost S-Curve, Planned Cost distribution from Financial Tab
- Burndown Chart, Work S-Curve from Project Progress tab
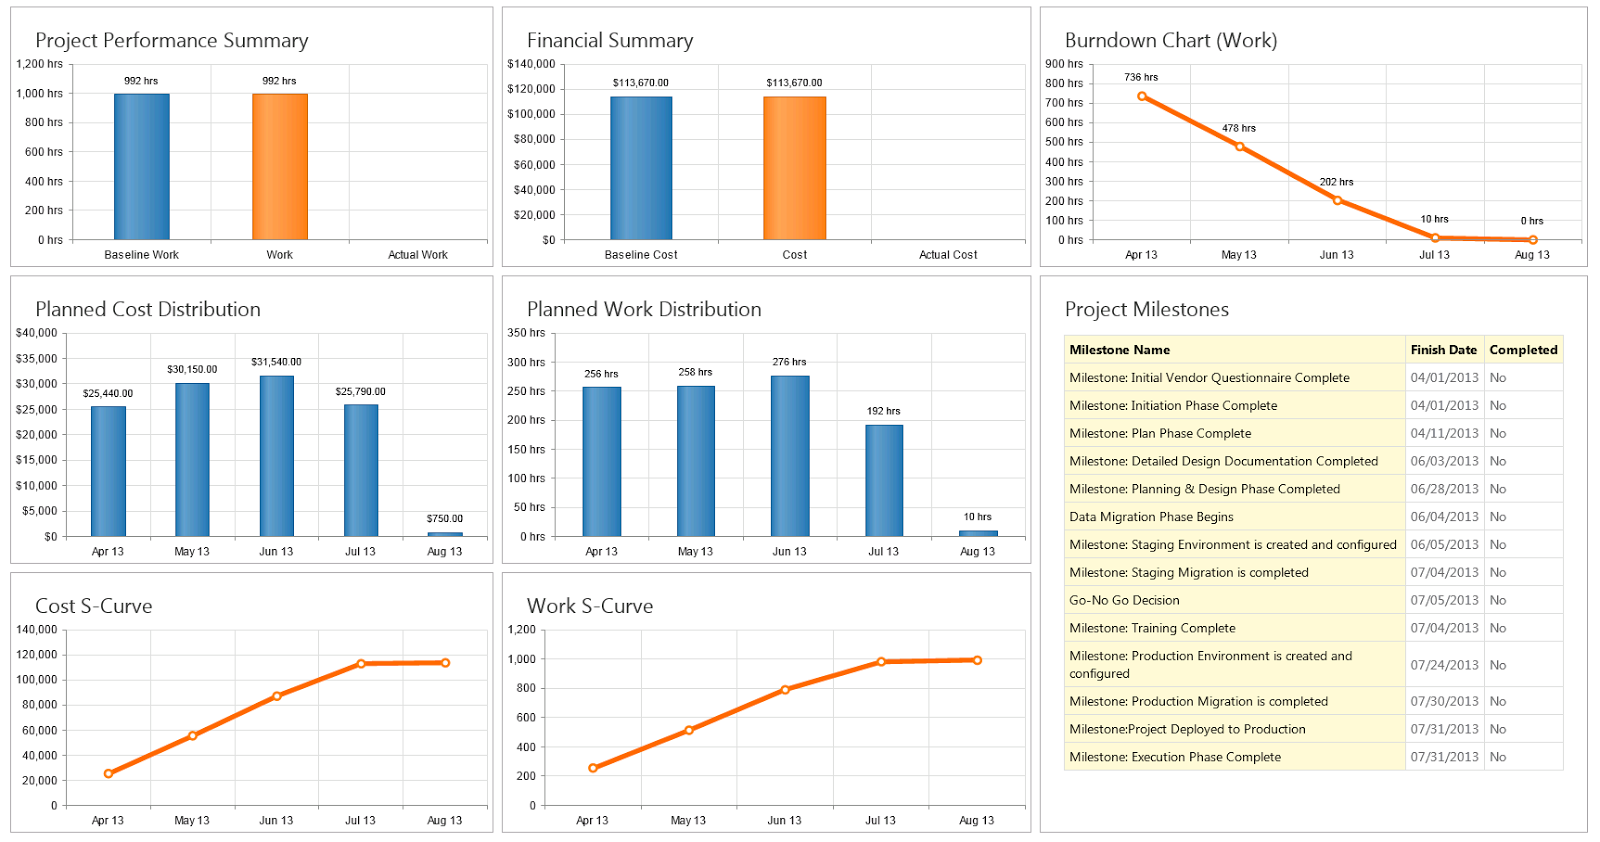
- Planned Work Distribution, Project Milestones, Project Performance Summary (Baseline) from Project Summary Tab
After re-positioning / re-sizing of widgets, dashboard that I just created looks as following:
Feel free to add / replace charts or create one more dashboard for this stage.
Note: Do not forget to make dashboard public - this will be required to add them to PDPs.
Project Execution Stage
On this stage we need to see in-flight information. Progress. Late tasks. Milestones.Dashboard that I just created for this stage looks as following:
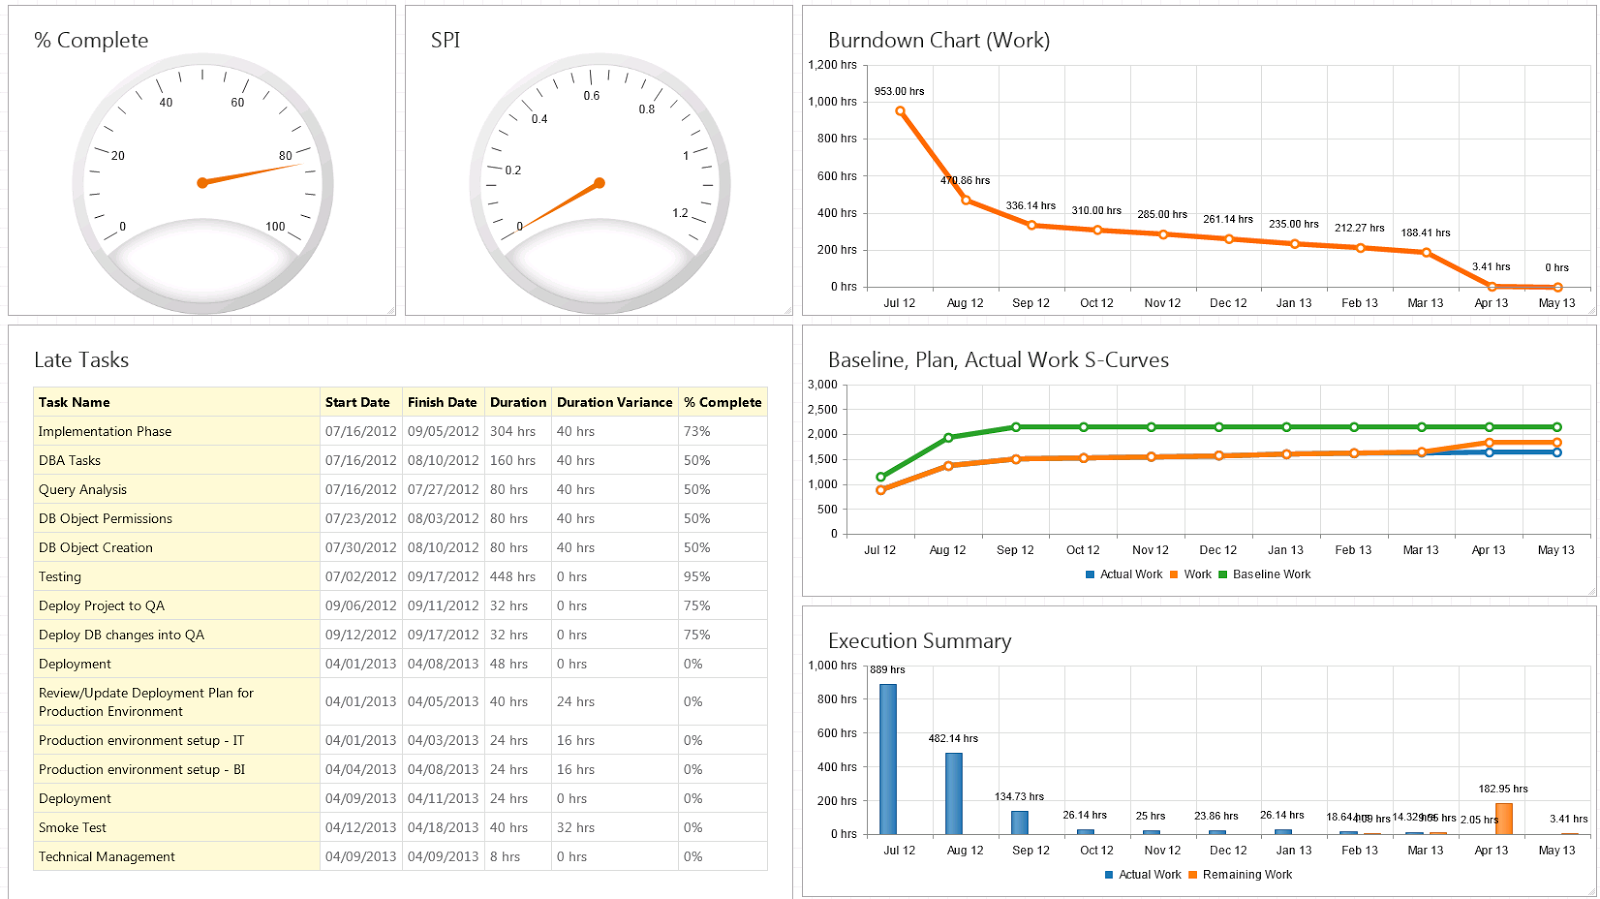
(Screenshot displays not a full dashboard - it has one more level that did not fit into the screenshot)
Project Closing / Project Closed Stage
On this stage we recommend displaying summary metrics from project how it was executed and perform a "lessons learned" analysis on the project. What went wrong? What was great and accurate? What can we improve with next projects? We've developed a number of widgets for that as well - users can find multiple widgets focused on accuracy and variations that serve the best for these goals (for sure, we can display only what can be "measured", this is just one aspect of "lessons learned" or retrospective review).Sample dashboard that I just created for this stage looks as following:

Now - we have 4 dashboards created and we can add them to the PDPs that we already have.
Adding dashboard to PDP
Go to Server Settings - Project Detail Pages and click on Project Initiation Dashboard PDP.
Go to Site Actions and select Edit Page
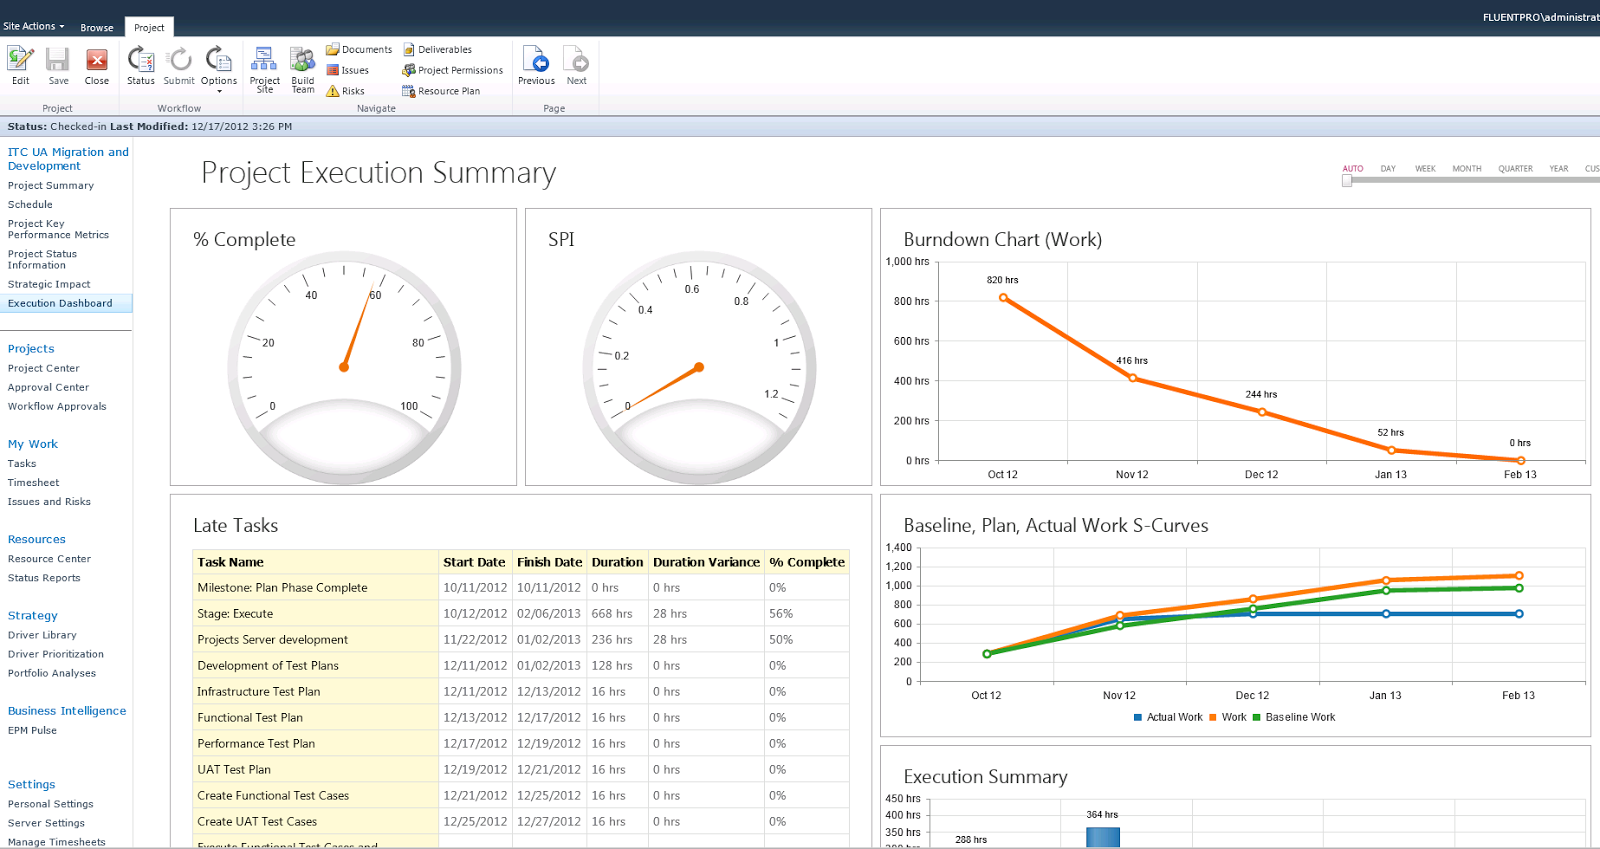
If there is no EPM Pulse Viewer webpart, add it - click on Add a Web Part, select FluentPro EPM Pulse on the left and select EPM Pulse Dashboard Simple Viewer. Press Add button

Go to the EPM Pulse Viewer webpart on the page and click on Edit Webpart and in first dropdown select Dashboard that we created (Project Initiation Dashboard).

That's it. Perform this step for all PDPs and now projects will display EPM Pulse dashboard on one of the PDP depending on project workflow stage.
Wasn't that extremely easy? Isn't that looks good? I would say - awesome!
Webinar about EPM Pulse
We would like to invite you to our webinar on about benefits of using EPM Pulse and Project Server 2010 together. Webinar will take place on June 11th at 9AM PST; You will learn more about EPM Pulse and creating portfolio and project level dashboards.
Please sign up here - and it is absolutely FREE.
Please sign up here - and it is absolutely FREE.
Other posts in this series
- Part 1: Visualization of project lifecycle with help of Dynamic Workflow solution starter and FluentPro EPM Pulse for Project Server 2010
- Part 2: Designing Project level dashboards with EPM Pulse for Project Server 2010
- Part 3: Designing Portfolio level dashboards with EPM Pulse for Project Server 2010
2 Komentar
BalasThis is really interesting, You're a very skilled blogger. I have joined your feed and look forward to seeking more of your magnificent post. Also, I've shared your site in my social networks! itunes store login
This calculator automatically figures the balloon payment based on the entered loan amortization period. canada mortgage calculator Currently the qualification rate for a fixed rate high ratio mortgage is the 5 year. mortgage calculator canada
Balas