It this post, I will try to provide a step-by-step instructions how to a full create environment with simplified workflow using Dynamic Workflow solution starter and later in next post we will visualize information using dashboards created in EPM Pulse. This will be a pretty big post - but it will allow users to get started with Project Server 2010 with workflow and great data visualization. Be prepared for some reading and couple hour of manual creation of configuration elements in Project Server (if you do not use FluentBooks for Project Server 2010).
This post will cover several sections:
- Installation of Dynamic Workflow solution starter
- Definition of Workflow
- Create Fields & Lookup Tables
- Define and create Drivers and Driver Prioritization
- Create PDPs
- Create Phases
- Create Stages
- Create Workflow
- Create EPT
Assumptions
- You have some experience of administering of Project Server 2010
- You have Project Server administrator rights
- For simplicity we will not use Departments feature in Project Server 2010
- This post assumes that you have resource pool built and maybe using generic resources along with work and cost resources
Installation of Dynamic Workflow solution starter
I will assume that you have a Dynamic Workflow Solution Starter that you compiled and is ready for installation. If you don't:
- please go to
http://archive.msdn.microsoft.com/P2010SolutionStarter, click on downloads and download source.zip
- open solution with Visual Studio 2010 and compile the Solution Starter
- You need to have following files in order to deploy Solution Starter:
Open the
DeployPowerShell.Cmd file and edit its content - you need to edit Site URL:
--------------
@echo off
Set DeploymentPackageFolder="."
Set SiteUrl="http://w2008r2ps/demo2"
Set SolutionFolder="./"
Set SolutionName="DMDynamicWorkflow.wsp"
Set FeatureName="DMDynamicWorkflow_DynamicWorkflow"
cd %DeploymentPackageFolder%
PowerShell -file .\Deploy.ps1 %SiteUrl% %SolutionFolder% %SolutionName% %FeatureName%
pause
---------------
In my case, the URL with PWA where it will be deployed is
http://w2008r2ps/demo2.
You need to log to the computer as farm administrator and run this script
DeployPowerShell.Cmd from command line:
We strongly recommend to run
RestartServices.bat after Dynamic Workflow solution starter install. This will restart IIS and Queue services.
To make sure that Dynamic Workflow in up and running, go to your browser and type the following URL:
http://w2008r2ps/demo2/_layouts/WrkSetng.aspx (replace http://w2008r2ps/demo2/ with you PWA url):
Click on
Add a workflow:
In the window that displayed you should see the
DM DynamicWorkflow - that means it was installed and we expect it to be functional.
Designing a Project Server Workflow
To make things a slightly simplified, we will create a workflow with 5 Phases and 5 Stages (one phase can contain one or more stages, but we should be good with just one stage per phase). Our workflow will be potentially ready for the Portfolio Analysis and will include all the required elements:
| Phase |
Stage |
PDPs |
Description |
| Project Initiation |
Project Initiation |
- New Project Information
- Strategic Impact |
On this phase / stage, project request is initiated by users; All requests are captured so they can be later prioritized and only selected projects will go to detailed planning / execution. On this stage, initial planning is
performed. |
| Project Selection |
Project Selection |
- Project Summary
- Strategic Impact
- Schedule
- Project Selection Dashboard |
On this stage, the portfolio analysis component can be "plugged-in".
In our scenario there will be no portfolio analysis, and only projects that
are selected will move to the next stage. |
| Project Planning |
Project Planning |
- Project Summary
- Project Key Performance Metrics
- Schedule
- Strategic Impact
- Planning Summary Dashboard |
On
this stage, detailed plan should be create, project should be resourced |
| Project Execution |
Project Execution |
- Project Summary
- Project Key Performance Metrics
- Schedule
- Project Status Information
- Strategic Impact
- Execution Dashboard |
Project Execution and Tracking |
| Project Closing |
Project Closing Stage |
- Project Summary
- Project Status Information
- Schedule
- Statistics Dashboard |
Project is completed or canceled. PMO, Mamangement and Project Managers shoud analyze information and perform a "lessons learned" exercise |
| Project Closed |
Project Closed |
- Project Summary
- Project Status Information
- Schedule
- Statistics Dashboard |
Project is closed. This is the terminal stage of the project. |
As you can see, I've listed all the Phases, Stages and PDPs that will be visible on those stages - and to make system more flexible, we will have different sets of PDPs for each stage.
There is one element that is missing in this table. It is possible also to control a "read-only" status of fields on specific workflow stages. Again, for simplicity, in this scenario we will make all the fields read-only on
Project Closing and
Project Closed stages.
So, our workflow structure is defined (designed), now we will get a technical section - creation of all elements.
Creating Custom Fields and Lookup Tables
Custom fields are created via Server Settings -> Enterprise Custom Fields and Lookup Table section
we will create following lookup tables with values:
| Lookup
Name |
Value |
| FP Indicator |
Black |
|
Green |
|
Red |
|
Yellow |
| FP Project
Type |
Program |
|
Project |
| Portfolio |
Portfolio A |
|
Portfolio B |
|
Portfolio C |
| Program |
CM tools |
|
FluentPro Audit
Family |
|
FluentPro Data
Visualization Family |
|
FluentPro PS
Customization |
|
FluentPro Web Tools |
|
Project Site Tools
Family |
| Resource Role |
Business Analyst |
|
Coordinator |
|
Developer |
|
IT |
|
Manager |
|
Project Manager |
|
Quality Assurance |
|
Training Lead |
|
Vendor |
On the next step, we will create following fields:
| Field
Name |
Entity |
Type |
Lookup Table |
| Budget
(Provided) |
Project |
Cost |
|
| Budget
(Requested) |
Project |
Cost |
|
| Budget
Document Reference |
Project |
Text |
|
| Business
Objective |
Project |
Text |
|
| FP Project
Type |
Project |
Text |
FP Project Type |
| Go-Live Date
(Actual) |
Project |
Date |
|
| Go-Live Date
(Forecast) |
Project |
Date |
|
| Major
Accomplishments Current Period |
Project |
Text |
|
| Major
Accomplishments Next Period |
Project |
Text |
|
| Portfolio |
Project |
Text |
Portfolio |
| Program |
Project |
Text |
Program |
| Project
Description |
Project |
Text |
|
| Project Notes
(General) |
Project |
Text |
|
| Project
Progress Notes |
Project |
Text |
|
| Project Scope |
Project |
Text |
|
| Resource Role |
Resource |
Text |
Resource Role |
| Status -
Budget |
Project |
Text |
FP Indicator |
| Status -
Quality |
Project |
Text |
FP Indicator |
| Status - Red
Explanation |
Project |
Text |
|
| Status -
Resources |
Project |
Text |
FP Indicator |
| Status -
Schedule |
Project |
Text |
FP Indicator |
| Status - Scope |
Project |
Text |
FP Indicator |
| Status -
Update Date |
Project |
Date |
|
| Status -
Yellow Explanation |
Project |
Text |
|
Creating Drivers and Driver Prioritization
For our scenario - I will create 4 drivers and we will prioritize them - so we can define in future strategic impact for each of the projects.
To create drivers, to to PWA and click on Driver Library link in main menu on the left.
You will get to the page with drivers (it should be empty by default):
Use buttons on ribbon to create new drivers
Please note that you should define and create your own drivers that are specific for your organization.
To prioritize drivers, click on Driver Prioritization in PWA main menu. To create new prioritization, click on New on the ribbon. Window will appear where you need to enter prioritization name and select drivers that will be included into prioritization:
Then click on Prioritize Drivers and system will walk you via several steps of prioritization, depending on number of drivers included.
Creating PDPs
As next step, we need to create PDPs. PDPs are SharePoint pages that can display information from project level custom fields with help of special web part, called Project Fields web part. Users can place other webparts to PDPs - standard or custom. We will create 3 types of PDP:
- PDP for project creation
- PDP that will host EPM Pulse Dashboards
- PDPs that will display information from project
We will create the following PDPs:
- New Project Information
- Project Selection Dashboard
- Planning Summary Dashboard
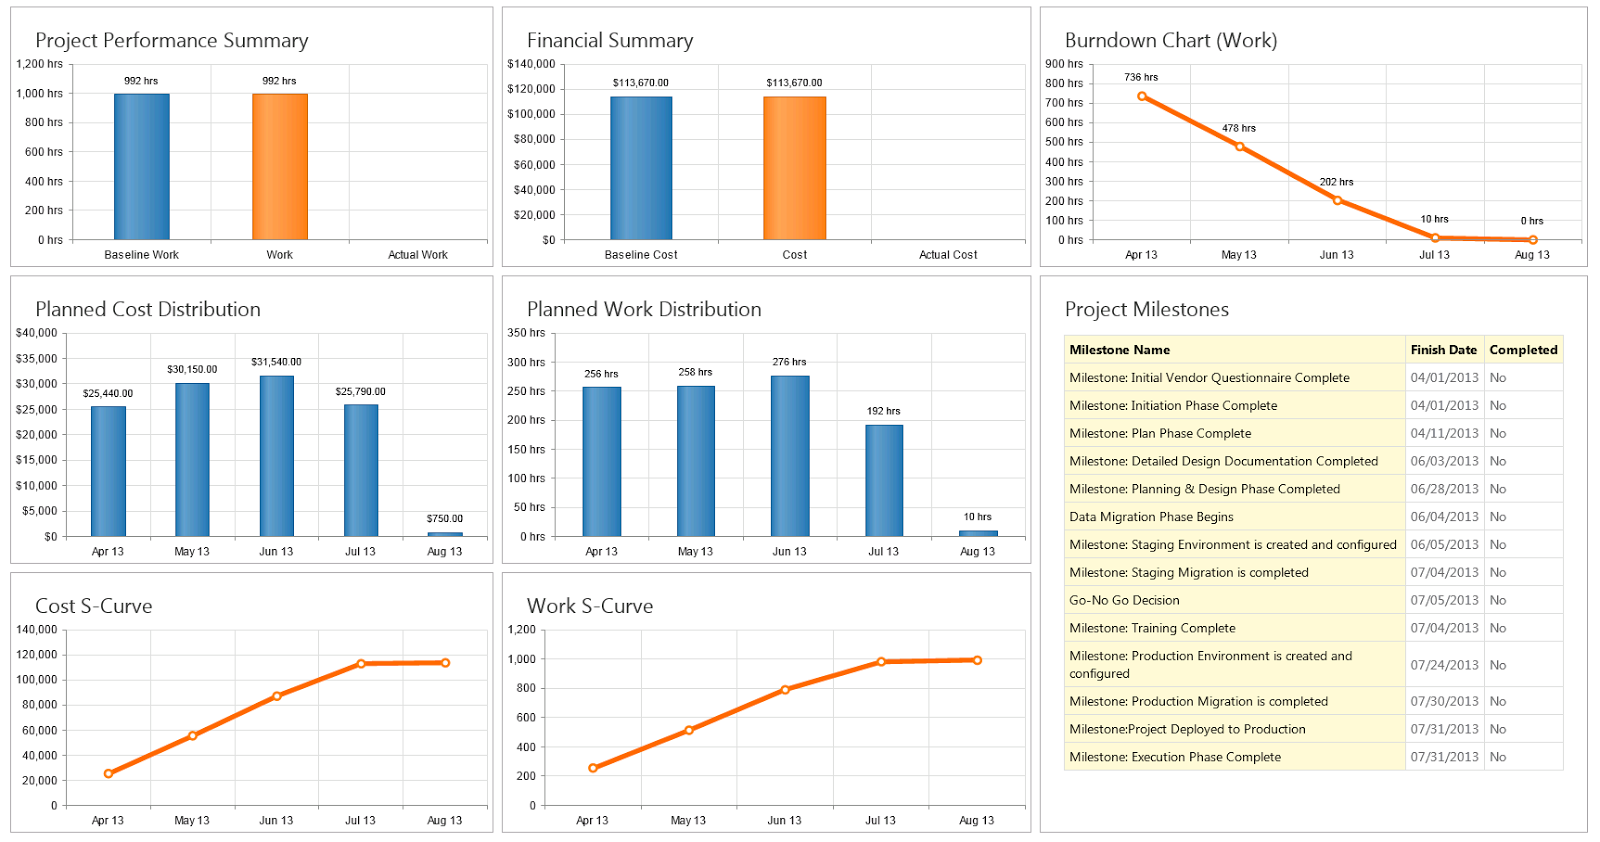
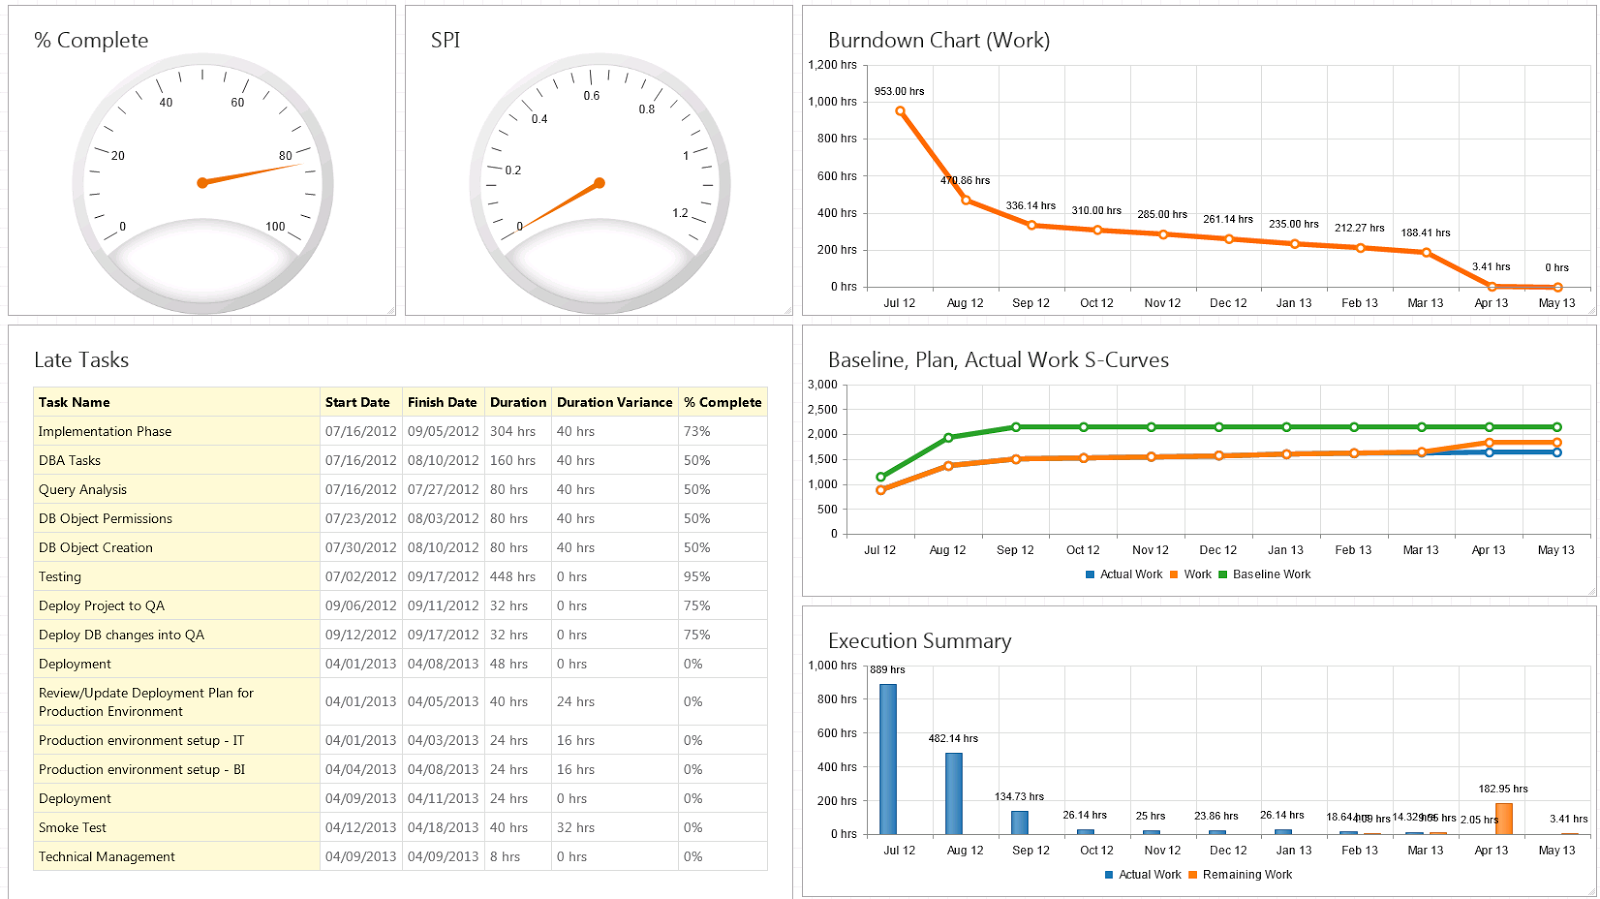
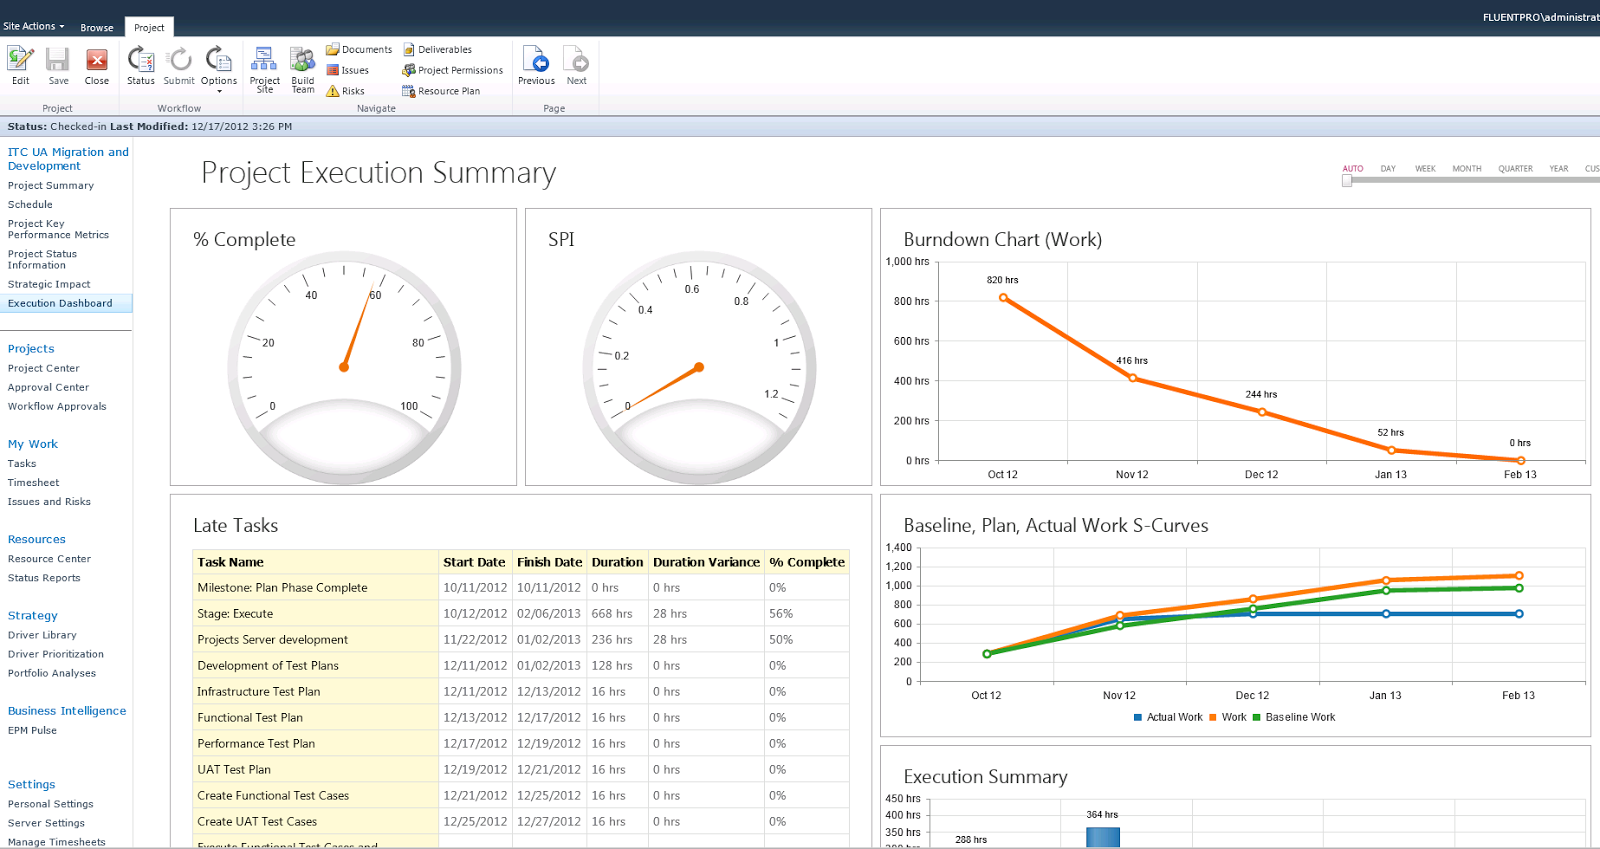
- Execution Dashboard
- Statistics Dashboard
- Project Summary
- Project Information
- Project Key Performance Metrics
- Project Status Information
To create new PDP:
1. Go to Server Settings -> Project Detail Pages
2. Click on Ribbon on a Documents Tab and then on New Document
3. On displayed page enter PDP file name and select layout template (I prefer to use Full Page, Vertical; other users prefer different layouts) and click on Create:
On displayed page, click add webpart and from dialog select a webpart:
- for Dashboard Pages, select EPM Pulse Simple Viewer webpart
- for "normal" PDP Pages select Project Web App -> Project Fields Webpart and select click on Add button.
Webpart will be added to the PDP.
To add fields to Project Fields web part, click on small dropdown arrow on webpart in top right corner and then click on Edit Webpart - > Modify (in Displayed Custom Fields Area) and then select fields that need to go to that web part. Below is a table with all fields for specific PDPs:
| New
Project Information |
|
| Business
Objective |
| Finish |
| Owner |
| Portfolio |
| Program |
| Project Name |
Start
Finish |
| Description |
|
| Key
Performance Metrics |
|
| % Complete |
| % Work Complete |
| Actual Finish |
| Actual Start |
| Baseline Cost |
| Baseline Duration |
| Baseline Finish |
| Baseline Start |
| Baseline Work |
| Budget (Provided) |
| Budget (Requested) |
| Budget Cost |
| Budget Work |
| Cost |
| Cost Variance |
| CPI |
| Duration |
| Duration Variance |
| Finish |
| Go-Live Date (Actual) |
| Go-Live Date (Forecast) |
| Remaining Duration |
| Remaining Work |
| SPI |
| Start |
| Work |
| Work Variance |
|
| Project
Status Information |
|
| Major
Accomplishments Current Period |
| Major Accomplishments Next Period |
| Project Notes (General) |
| Project Progress Notes |
| Status - Budget |
| Status - Quality |
| Status - Red Explanation |
| Status - Resources |
| Status - Schedule |
| Status - Scope |
| Status - Update Date |
| Status - Yellow Explanation |
|
| Project
Summary |
|
| Budget
(Provided) |
| Budget (Requested) |
| Budget Document Reference |
| Business Objective |
| Finish |
| Go-Live Date (Forecast) |
| Owner |
| Planning Start Date |
| Portfolio |
| Priority |
| Program |
| Project Departments |
| Project Name |
| Project Scope |
| Start |
| Description |
Create Workflow Phases
To create Phases, go to Server Settings -> Workflow Phases and click on
"New Workflow Phase" button. In displayed window, enter the name of the Phase, Description ( Optional) and click on Save Button.
Phases that should be created listed below:
| Phase |
| Project Initiation |
| Project Selection |
| Project Planning |
| Project Execution |
| Project Closing |
| Project Closed |
Create Workflow Stages
As the next step, we will create Workflow Stages. To to Server Settings -> Workflow Stages and click on
"New Workflow Stage":
Enter the Stage Name, Select appropriate phase and select and add PDPs that should be displayed on this Stage. At the bottom, you can select fields that should be required and read-only.
Please get list of PDPs for each stage from the following table:
| Phase | Stage | PDPs | Description |
| Project Initiation | Project Initiation | - New Project Information
- Strategic Impact | On this phase / stage, project request is initiated by users; All requests are captured so they can be later prioritized and only selected projects will go to detailed planning / execution. On this stage, initial planning is performed. |
| Project Selection | Project Selection | - Project Summary
- Strategic Impact
- Schedule
- Project Selection Dashboard | On this stage, the portfolio analysis component can be "plugged-in". In our scenario there will be no portfolio analysis, and only projects that are selected will move to the next stage. |
| Project Planning | Project Planning | - Project Summary
- Project Key Performance Metrics
- Schedule
- Strategic Impact
- Planning Summary Dashboard | On this stage, detailed plan should be create, project should be resourced |
| Project Execution | Project Execution | - Project Summary
- Project Key Performance Metrics
- Schedule
- Project Status Information
- Strategic Impact
- Execution Dashboard | Project Execution and Tracking |
| Project Closing | Project Closing Stage | - Project Summary
- Project Status Information
- Schedule
- Statistics Dashboard | Project is completed or canceled. PMO, Mamangement and Project Managers shoud analyze information and perform a "lessons learned" exercise |
| Project Closed | Project Closed | - Project Summary
- Project Status Information
- Schedule
- Statistics Dashboard | Project is closed. This is the terminal stage of the project. |
Creation of Workflow using Dynamic Workflow solution starter
To create new workflow using the Dynamic Workflow Solution starter, go to URL
http://w2008r2ps/demo2/_layouts/WrkSetng.aspx (replace http://w2008r2ps/demo2/ with you PWA url):
Click on
Add a workflow:
Click Next. Select a Workflow Stage from the drop-down and set the radio buttons as displayed on the next screen:
Add all stages as we defined above so your final workflow should look as displayed on next picture:
Click on Submit button - your workflow is ready to be used.
Creation of EPT (Enterprise Project Type)
Next step in our configuration is creation of EPT - Enterprise project type. EPT is a special "package" that defines what attributes should carry the project and combines all together workflow, project file template, project site template and set of PDP pages (for non-workflow project types).
We recommend to create a new project type that will be used to create projects with workflow that we designed but you can update any existing PDP.
Project Server Administrators can change Enterprise Project Type for project at any time if that's required as well as restart the workflow.
To create new EPM to to Server Settings - > Enterprise Project Types and click on
"New Enterprise Project Type" button.
In displayed window, specify the Name of new EPT, Workflow name that we create on previous step, Project Plan and Project Site template (if any custom will be used) and click Save button.
I created EPT called
FluentPro Project.
Our new EPT will be created and now we can start creating our projects and moving them to specific stages using Submit button on Workflow Status Page.
How to save time and not create everything manually?
You can download trial version of FluentBooks for Project Server 2010 and FluentBooks workspace that contains all elements except workflow. Using trial version, you can upload this workspace and it will create all elements in your PWA.
FluentBooks download: http://www.fluentpro.com/productsfluentbooks.html
Workspace Download: http://www.fluentpro.com/downloads/DynamicWorkflowWorkspace.zip
Steps are pretty simple:
1. Accept EULA, download and install FluentBooks on your server or on desktop that has connectivity to PWA
2. Download workspace from the link above and unpack from zip
3. Start FluentBooks, go to File - Open and open this file
4. Go to Upload /Export and make check-box selection as shown on the picture below
5. Click on the button "Select All Elements"
6. Enter URL of your PWA and credentials (if you current user has admin rights, you can use "Use Current Account"
7. Press Export button and FluentBooks will upload all the configuration.
You will save at least 2-3 hours of your time with using FluentBooks - and this trial version is absolutely free.
Note: There will be no workflow created yet; after you create a workflow please update EPT and select workflow that was created.
Summary
We created all required elements and workflow. As next step, we will create several dashboards using EPM Pulse and we will integrate them into the PDPs that we created, so on every stage the corresponding dashboard will be displayed.
Other posts in this series